The setup: one strategy, three data modes
To make the comparison concrete, we ran the same momentum strategy against BTCUSD data for a single day using three different data modes available in HFTS:
- OHLC 1-minute bars — the classic candle format. One aggregated bar per minute, 1,440 ticks for a full day.
- Last-trade ticks — every individual execution that printed on the exchange, with its exact timestamp and price. Around 16,000 events for the same day.
- Full quotes (bid/ask) with latency — every change to the best bid or best ask, plus simulated round-trip network delay. Over 62,000 events for the same day.
The strategy logic did not change between runs. Only the data source changed. The results are dramatically different.
The punchline upfront: OHLC says +1.70%. Last trades say -1.69%. Full quotes say -2.13%. The strategy does not have an edge — the OHLC result is an artifact of the data format, not a real signal.
Step 1: OHLC 1-minute bars — the optimistic baseline
OHLC bars are the default format for most backtesting frameworks. Each bar gives you four prices — open, high, low, close — and a volume figure. They are compact, widely available, and easy to work with. They are also a significant simplification of what actually happened during that minute.
When your strategy fires on an OHLC bar, the simulator fills your order at the bar's close price. It doesn't know whether the high came before the low, whether there was a spike and recovery, or what the bid/ask spread looked like. It assumes you could transact at that close price — which in a fast market is rarely true.
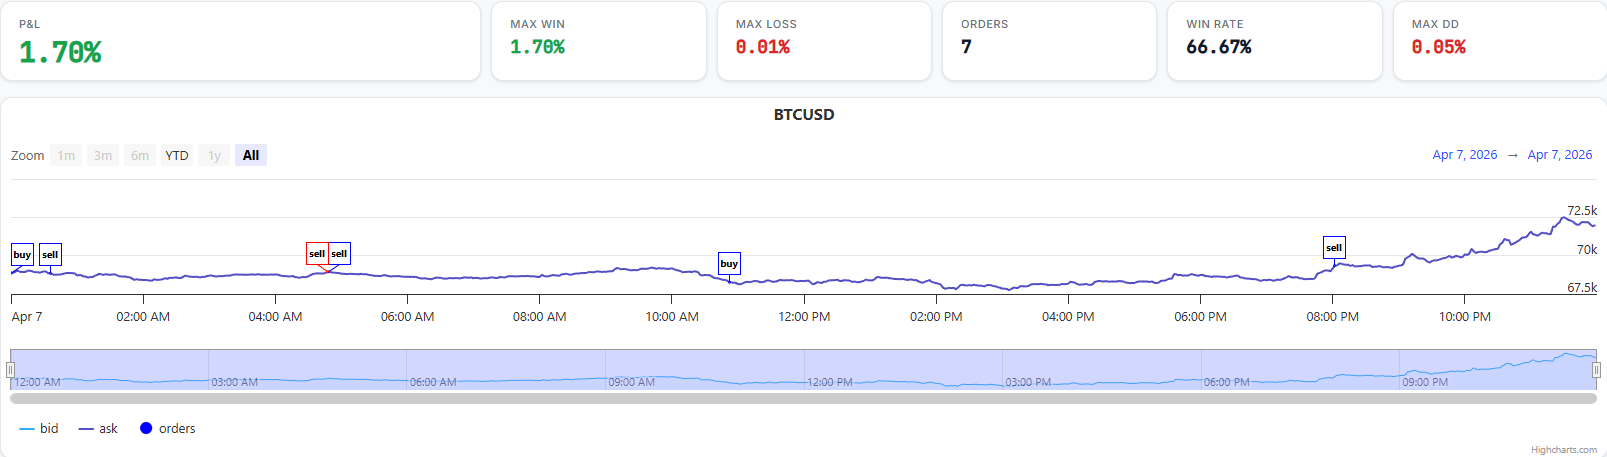
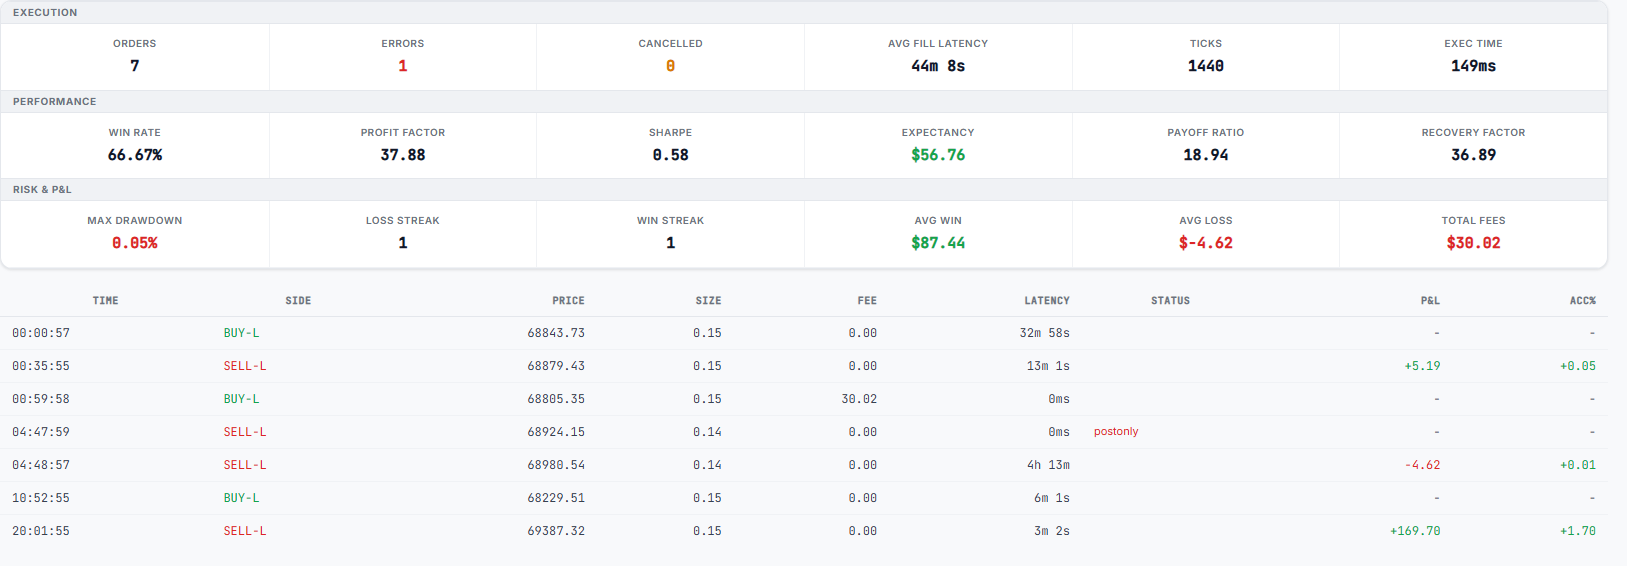
The numbers look impressive. Profit Factor of 37.88, win rate above 66%, drawdown under 0.1%. But look more carefully: only 7 orders were placed across an entire trading day. The strategy fired rarely because the OHLC signal aggregates many market movements into a single bar-close decision.
Seven fills is not a result — it is a hypothesis. A Profit Factor of 37 on 7 trades has essentially no statistical meaning. You would need hundreds of trades to begin estimating whether an edge exists. Here, the strategy happened to catch a few of the day's larger directional moves on a single day, and the fill model assumed each one executed cleanly at the bar close.
Rule of thumb: a Profit Factor above 3 on fewer than 30 trades is almost always noise. At 7 trades it tells you nothing reliable about whether the strategy works.
Step 2: last-trade ticks — the same strategy sees more reality
Last-trade data gives you every individual execution that printed on the exchange: timestamp, price, and size. For BTCUSD on an active day, that is around 16,000 events — more than 11 times the resolution of 1-minute OHLC.
With this data, your strategy now reacts to individual trades rather than minute-close prices. The signal logic is unchanged. What changes is when the signal fires and what price the simulator uses for fills.
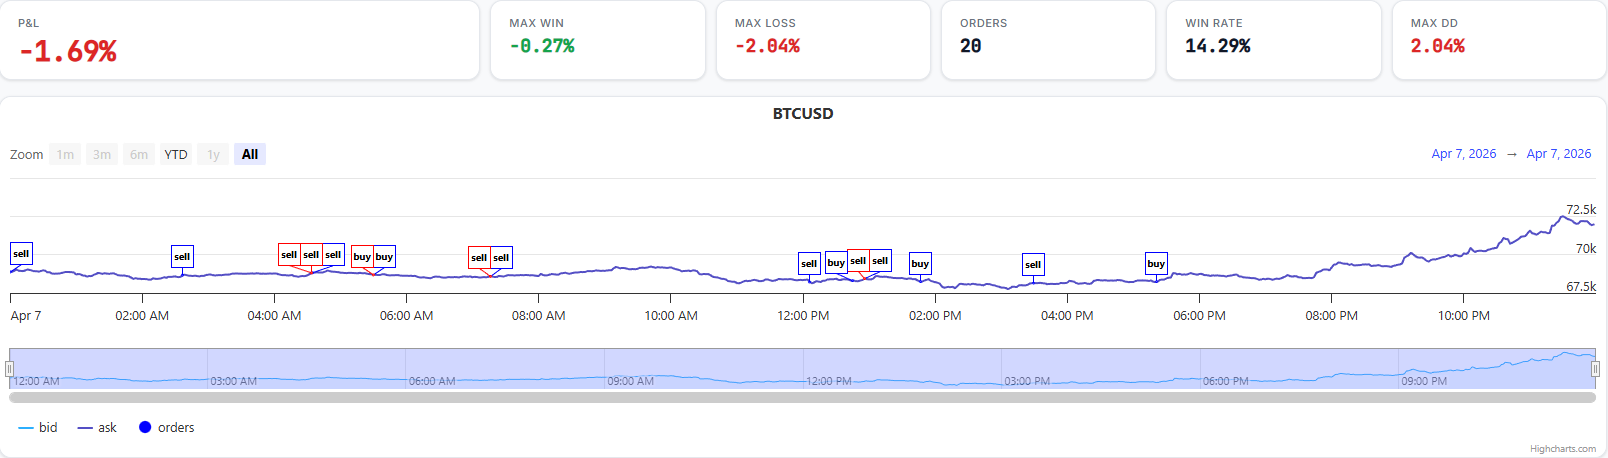
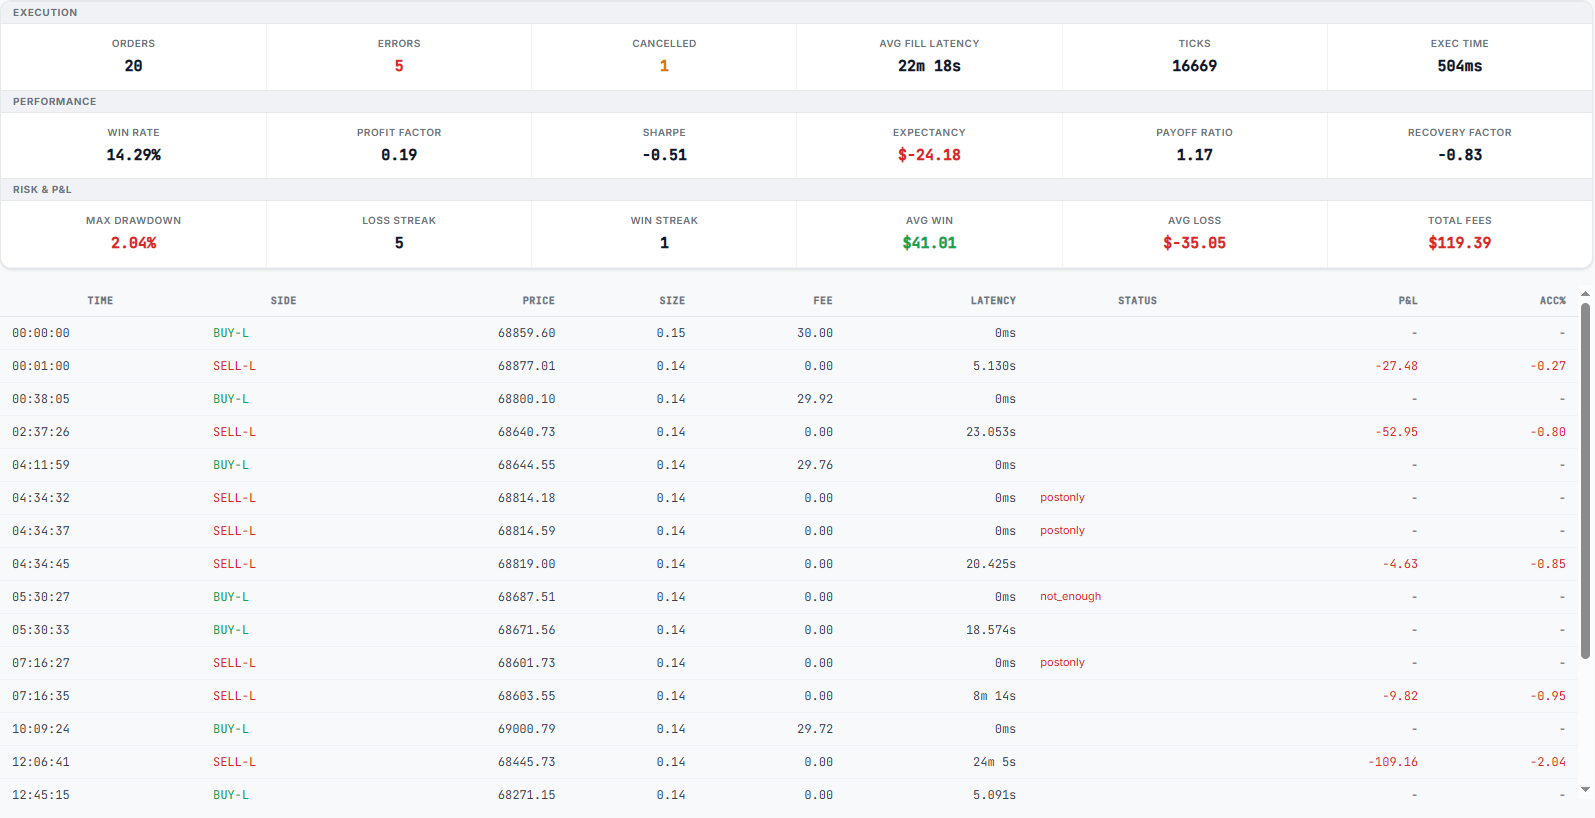
The strategy went from +1.70% to -1.69%. Profit Factor collapsed from 37.88 to 0.19. The strategy is now clearly losing.
Several things changed simultaneously when we switched from OHLC to trade ticks:
- More signals fired. 20 orders vs 7 — the strategy reacted to movements that were smoothed away inside the OHLC bar.
- Fee drag became visible. $127.39 in total fees vs essentially zero on the OHLC run. Each additional order has a cost, and at tick frequency those costs compound quickly.
- Fill assumptions remained optimistic. With trade-only data, the simulator still fills at the last traded price — it doesn't know the bid/ask spread. In a fast-moving market, the price you react to and the price you can actually transact at are often different.
| Metric | OHLC 1m | Last Trades |
|---|---|---|
| P&L | +1.70% | -1.69% |
| Orders placed | 7 | 20 |
| Win rate | 66.67% | 14.29% |
| Profit Factor | 37.88 | 0.19 |
| Total fees | $30.02 | $127.39 |
| Ticks processed | 1,440 | 16,649 |
The shift from OHLC to last-trade data did not reveal a bad strategy — it revealed the true strategy. The OHLC version was a fiction built from aggregated data and optimistic fill assumptions.
Step 3: full quotes with latency — the most honest picture
Full quote data gives you every change to the best bid or best ask: new prices, cancellations, size updates. This is the raw feed that a live trading system actually sees. For the same BTCUSD day, that's 62,452 events — four times more than last-trade data, and 43 times more than OHLC.
In addition to higher data resolution, HFTS injects simulated round-trip latency. When your strategy reacts to a quote update and sends an order, the order arrives at the book some time later — after the market may have moved. This is how a real execution environment behaves.
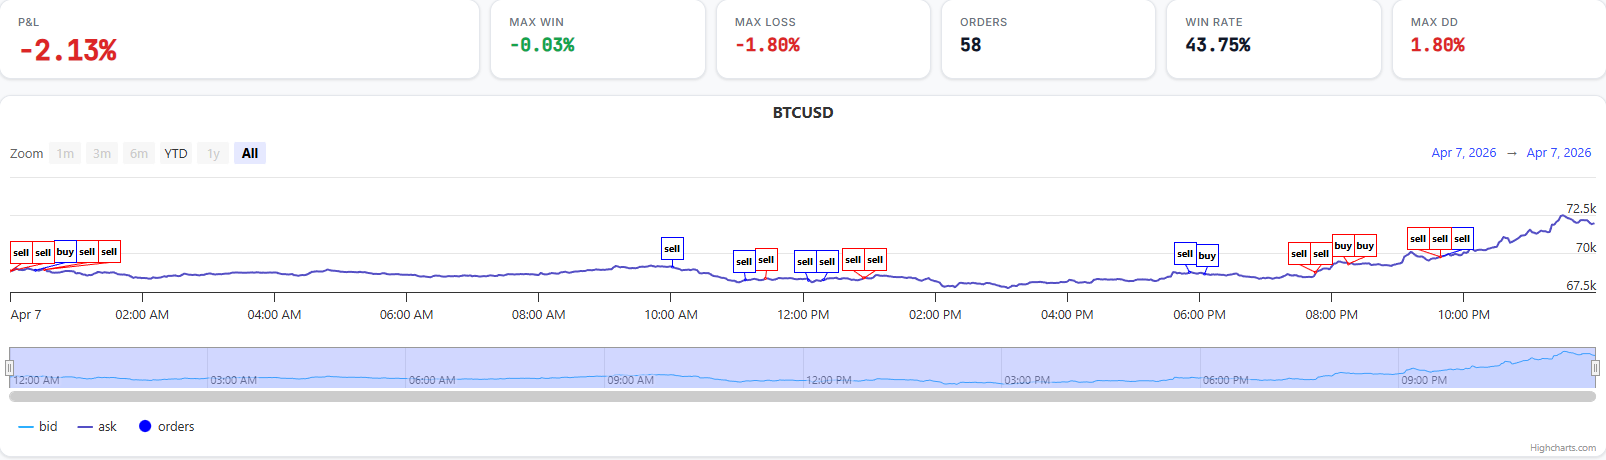
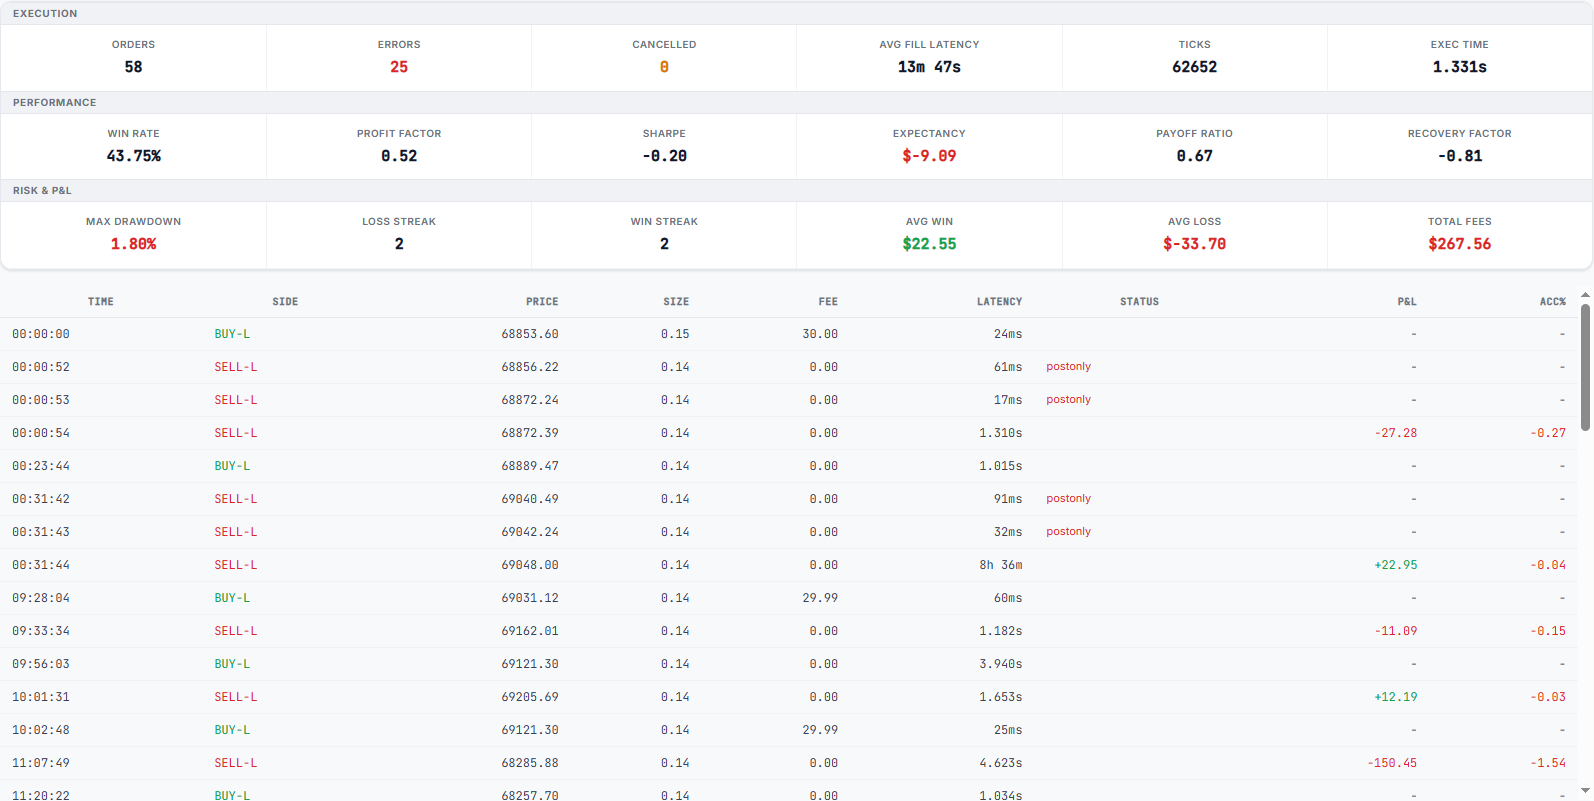
P&L settled at -2.13%, Profit Factor 0.52, Sharpe -4.38. The strategy is still losing — but a few things are worth noting about the quotes result compared to the last-trade result:
- Win rate recovered to 43.75% (from 14.29% on trade data). With full quote visibility, the strategy can see the spread and avoids some fills it was taking blindly on trade timestamps.
- Order count jumped to 58. The strategy now reacts to quote-level events — many of which are not actual trades — increasing signal frequency significantly.
- Latency is modelled. Orders experience realistic delay between signal and fill. Strategies that look fast on paper get exposed here.
Post-only orders and missed fills
There is one more layer of realism that quote-level backtesting exposes: not every order can be placed. Many exchanges and strategies use post-only limit orders — orders that are rejected if they would immediately match against the book (i.e. cross the spread). This is common when a strategy wants to earn the maker rebate and avoid taker fees, but it means that in fast-moving markets a significant fraction of intended orders simply do not go through.
On OHLC data this problem is invisible — the simulator always assumes your order filled. On trade data it is partially visible through missed signals. On full quote data with latency, it becomes concrete: by the time your order arrives, the best bid or ask may have moved past your limit price. A post-only order in that situation is either cancelled by the exchange or sits unmatched while the market moves away.
In practice: a strategy that fires 58 signals at the quote level may only successfully place 30–40 of them as post-only orders, and fill an even smaller fraction. The backtest numbers above assume all orders were placed — a real post-only strategy would show fewer fills, lower fee drag, but also a different PnL curve that depends heavily on which signals were actually routable at the moment of arrival.
This is why OHLC and even last-trade backtests tend to overestimate fill rates. They have no concept of market conditions at the moment of order placement. Quote-level simulation with latency is the first layer where post-only rejection and partial fills become visible — and where the gap between "signal fired" and "order filled" starts to match live trading reality.
A strategy that survives a quotes + latency backtest with positive P&L has cleared a much higher bar than one that only looks good on OHLC bars. If it passes here, you have a genuine candidate for live testing. If it fails here but passed on OHLC, you have saved yourself from a losing live trade.
The full comparison
| Metric | OHLC 1m | Last Trades | Full Quotes |
|---|---|---|---|
| P&L | +1.70% | -1.69% | -2.13% |
| Orders placed | 7 | 20 | 58 |
| Win rate | 66.67% | 14.29% | 43.75% |
| Profit Factor | 37.88 | 0.19 | 0.52 |
| Max drawdown | 0.05% | 2.04% | 1.80% |
| Total fees | $30.02 | $127.39 | $247.54 |
| Ticks processed | 1,440 | 16,649 | 62,452 |
| Sharpe ratio | 0.58 | -4.51 | -4.38 |
What to take away from this
The lesson here is not that this particular strategy is bad. The lesson is that OHLC backtesting inflates results by design. It collapses time, hides the bid/ask spread, smooths away intra-bar volatility, and assumes fills at synthetic prices. For lower-frequency strategies these simplifications are tolerable. For anything reacting at tick speed, they produce results that cannot survive contact with a live market.
A few practical rules this experiment supports:
- If your OHLC backtest has fewer than 30 trades, treat it as a hypothesis, not a result.
- A strategy that loses on last-trade data will almost certainly lose on quotes. Run the cheaper test first.
- Watch for fee drag: strategies that look clean on OHLC often become fee-dominated when signal frequency increases at tick resolution.
- Latency injection is not optional for HFT. The average fill delay visible in the quotes report reveals how often the market moved between signal and execution.
- Post-only orders are not always routable. If your strategy relies on maker fills, model the rejection rate — on OHLC and trade data it is zero by assumption, which is never true in production.
The same strategy, run on three data types, is three different experiments. The first is easy and flattering. The third is honest. HFTS exists to make the third experiment fast and accessible — before you commit real capital to a strategy that only worked on bars.